


User research reports that translate into product impact
No more design by committee. Build better with automated reports and analysis that drive decisions and influence based on actual user insights.


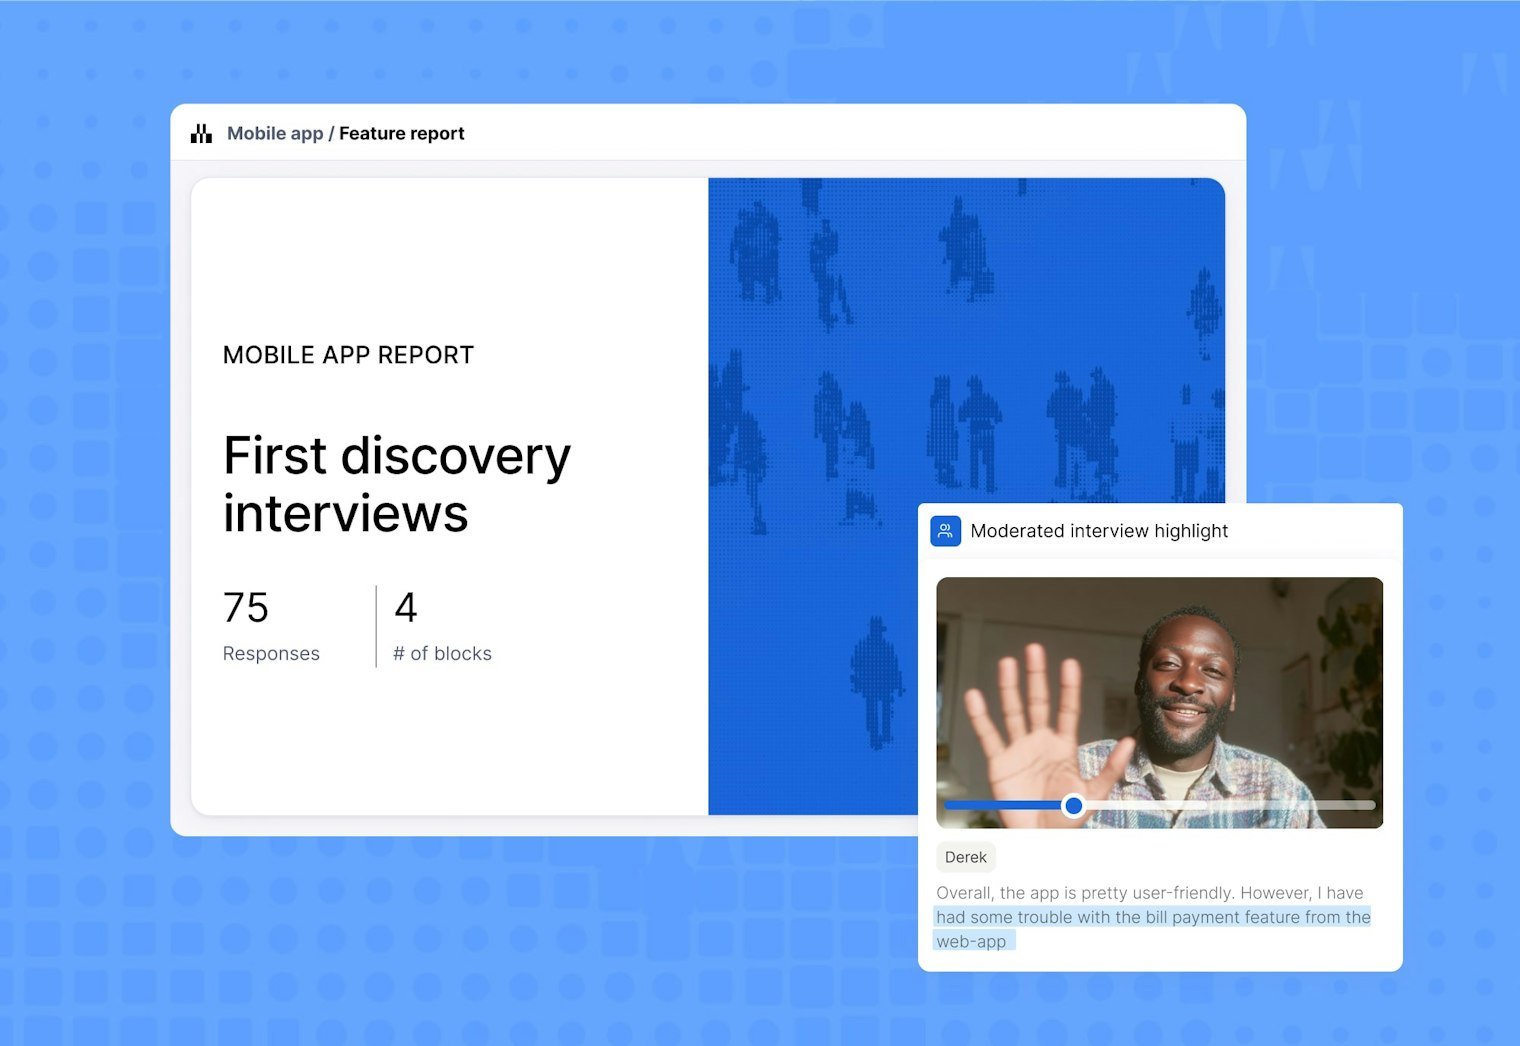
Shareable and customizable reports
Build influence and alignment while eliminating hours of manual work with automated, ready-to-share reports.


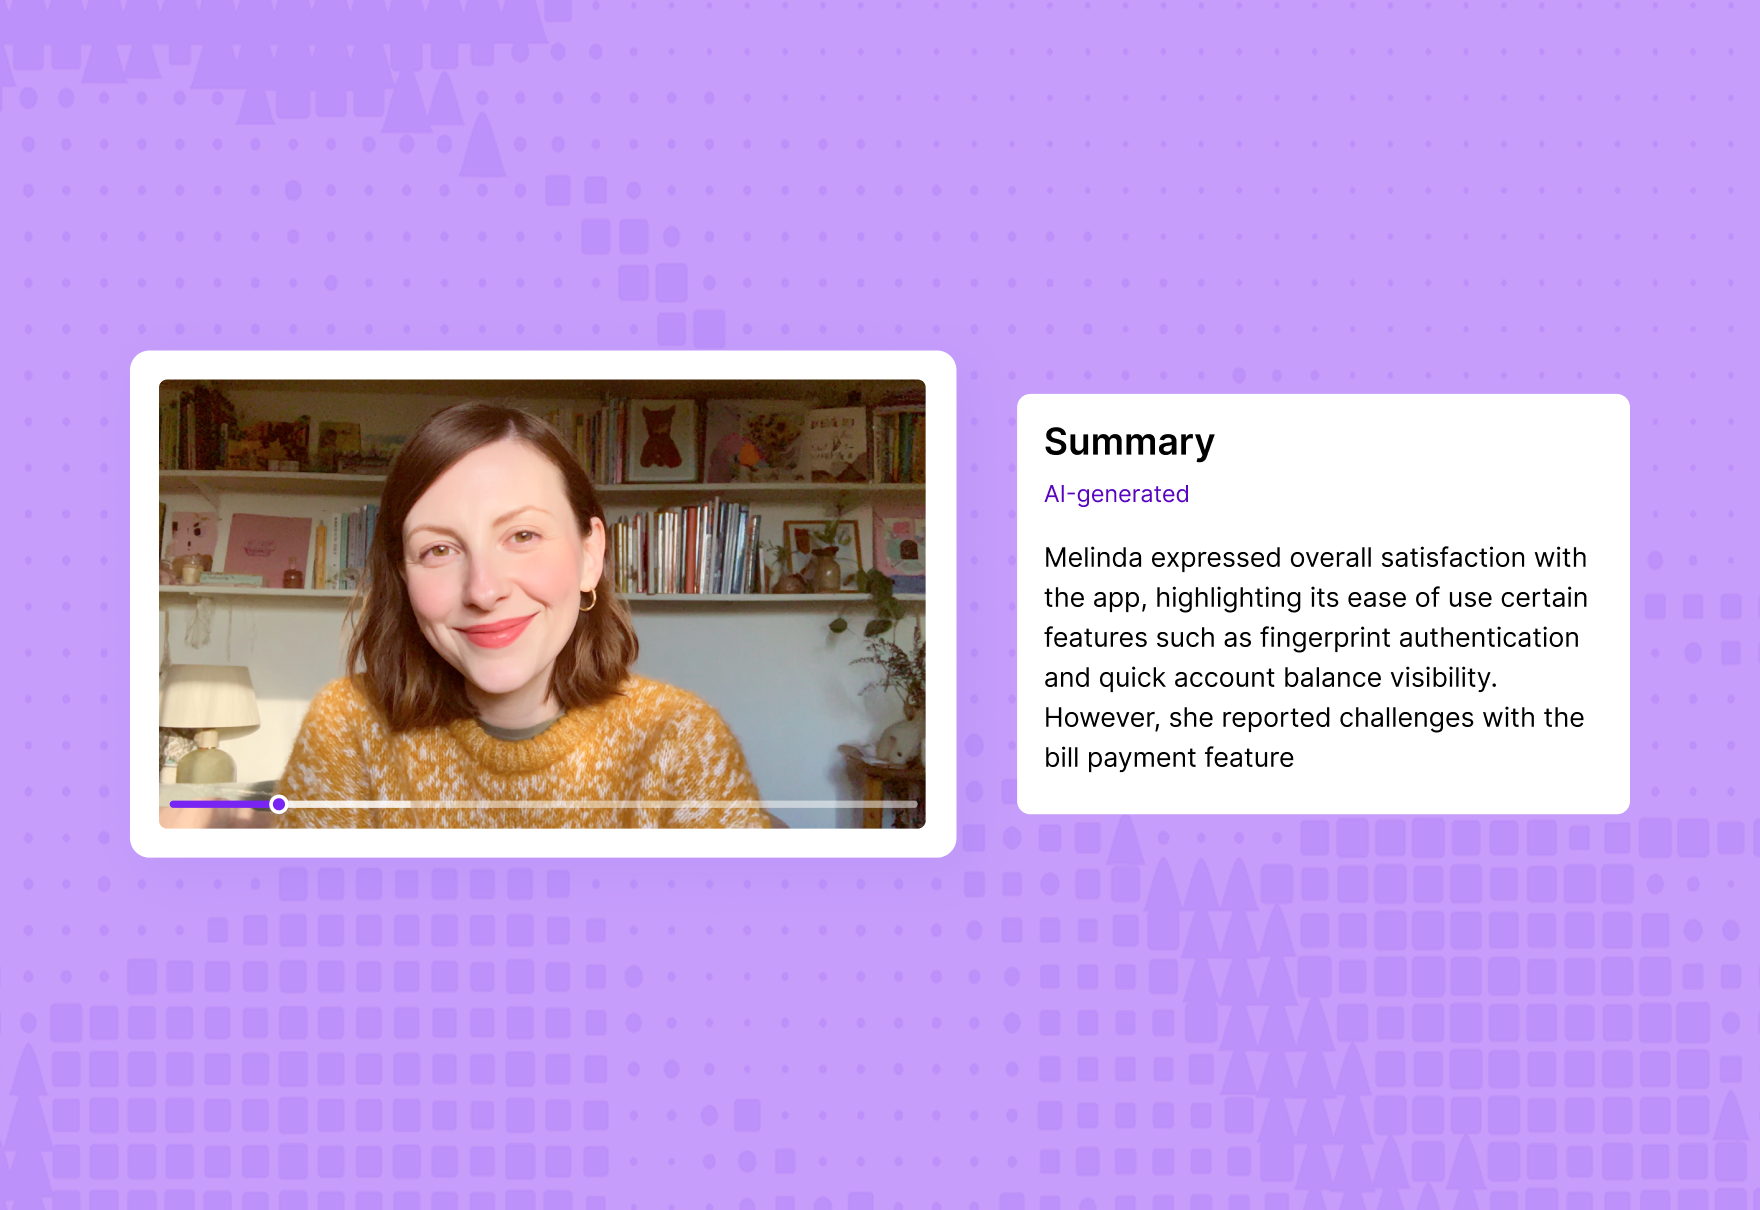

Reduce time spent analyzing user data, Maze does it for you
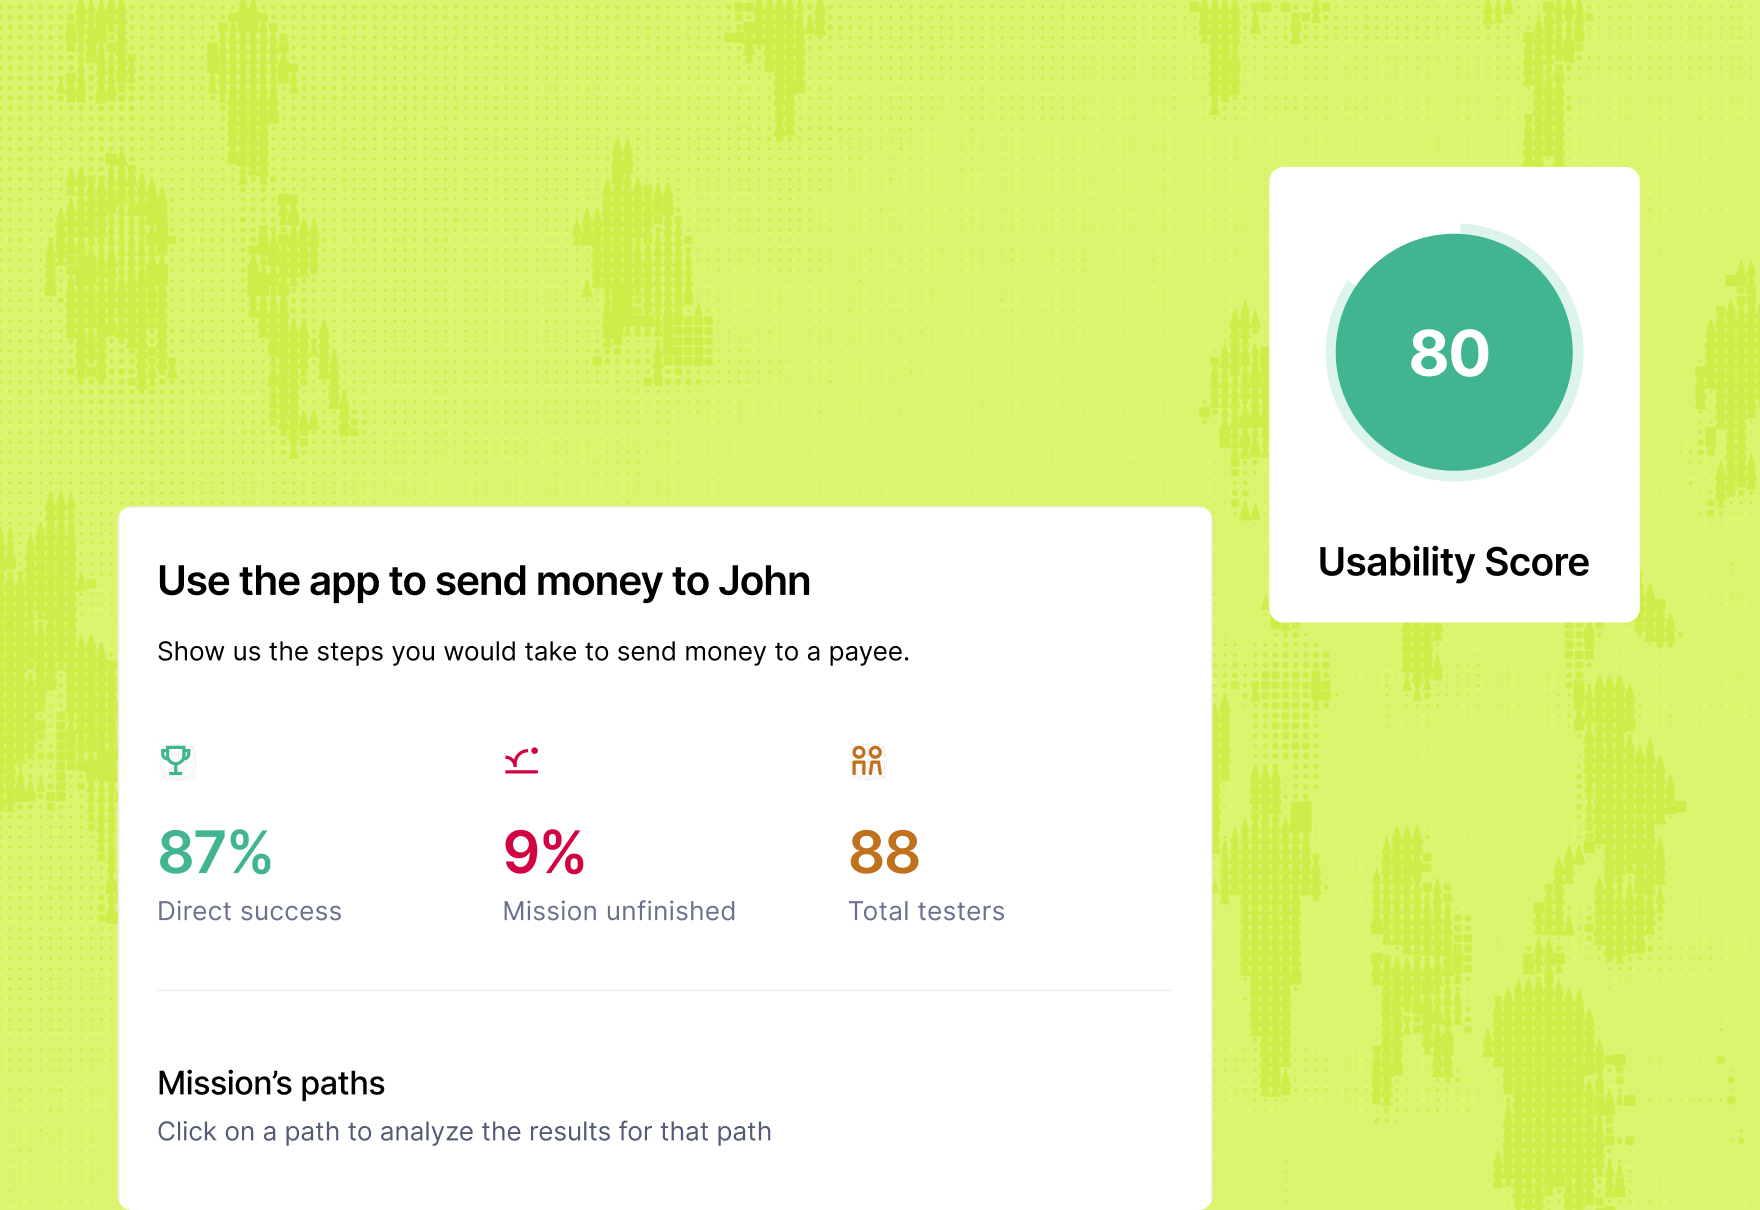
Capture your product’s usability with a unique score to help guide your future improvements.
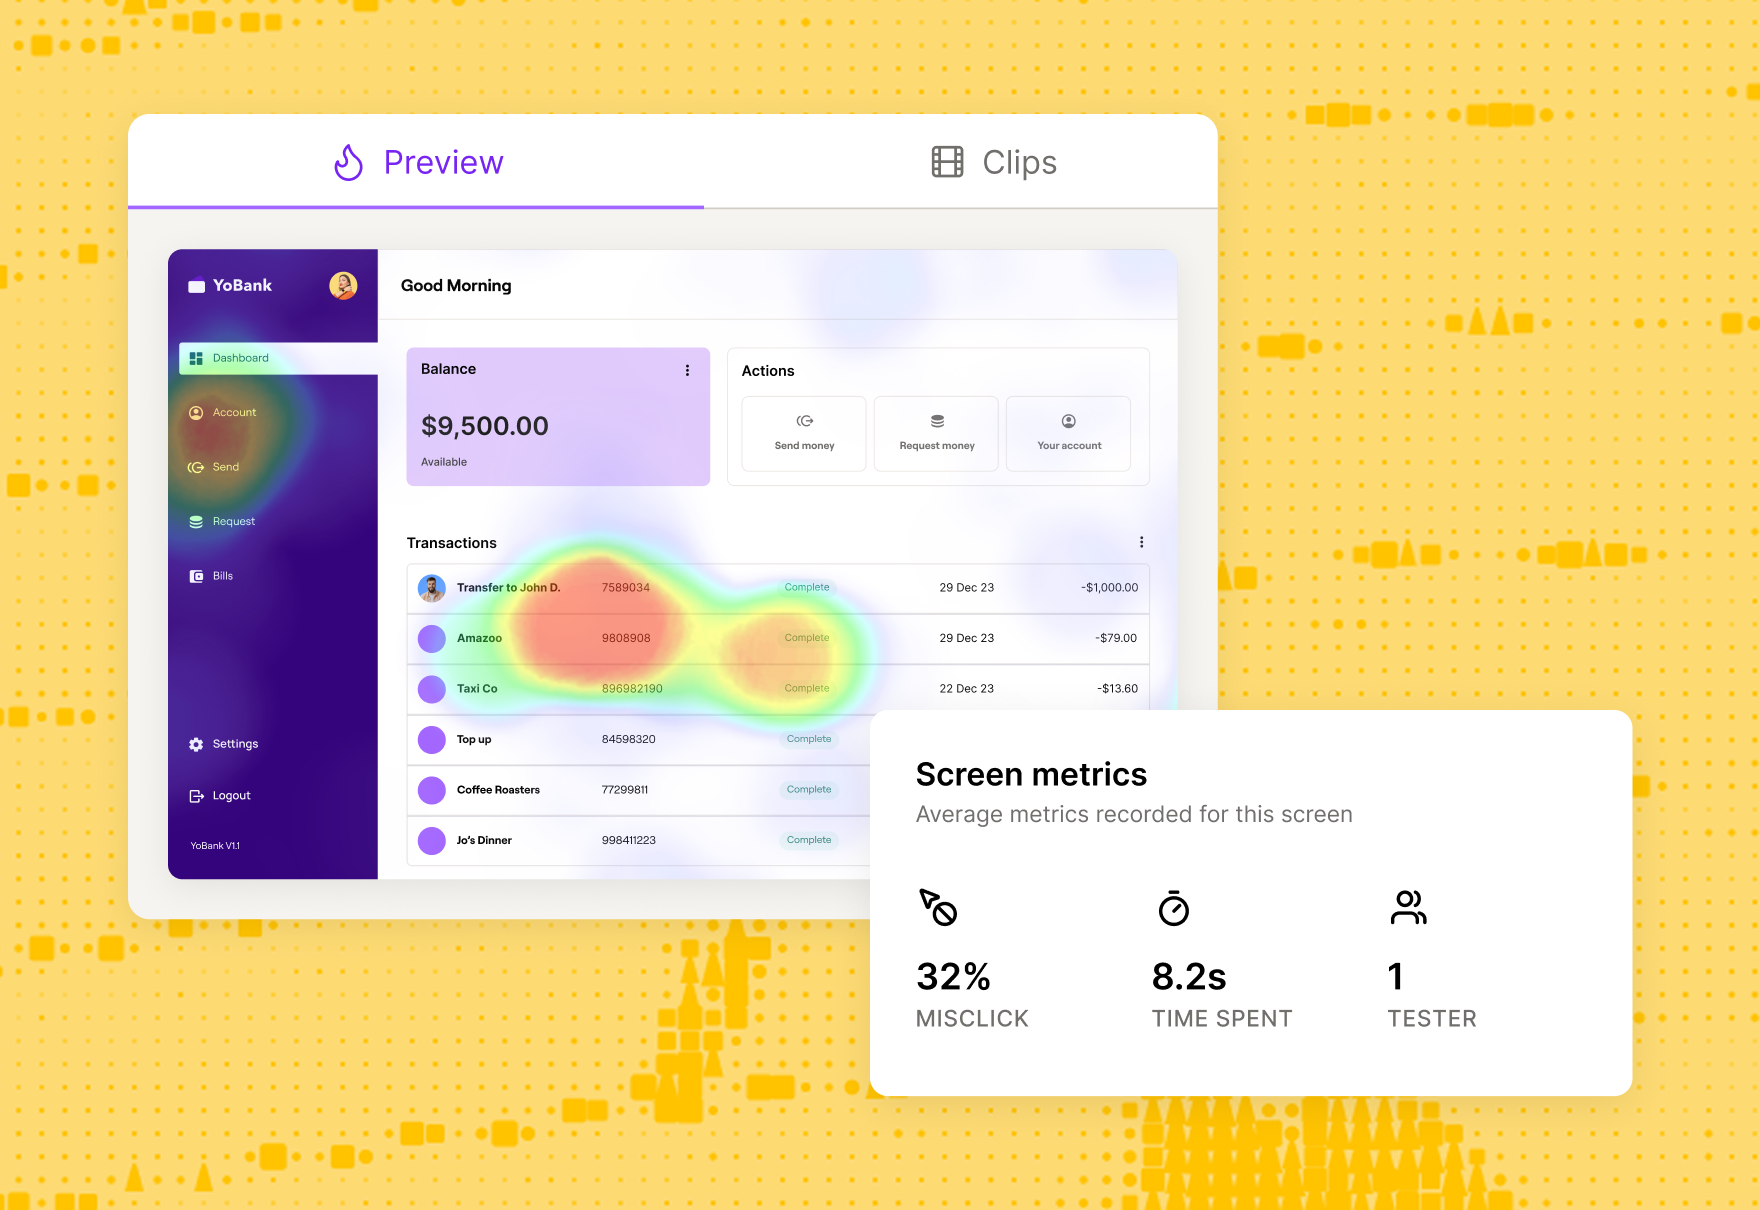
Dive deeper into user interactions with misclicks, exits, average duration, and success metrics for each screen.
See an overview of your expected mission paths, how testers interacted with them, and if any of your screens need rework.
Learn more about expected (and unexpected) user behavior from heatmaps, and discover how users navigate your prototypes.
Maze is crafted for the curious


Maze's AI is incredible—it surfaces things we hadn’t considered, which has an immediate impact on how we approach our work.
Cheyenne Ward
UX Lead


Maze's AI summarization and analysis is a big step up from other solutions we've tried. The quality of insights generated makes our interview analysis more effective.
Renee Goulette
User Experience Researcher


With Maze, the data was incredibly easy to understand and parse because it was presented visually.
Janet Taylor
Senior Director, Product Design & Research
Maze's AI is incredible—it surfaces things we hadn’t considered, which has an immediate impact on how we approach our work.
Cheyenne Ward
UX Lead
Maze's AI summarization and analysis is a big step up from other solutions we've tried. The quality of insights generated makes our interview analysis more effective.
Renee Goulette
User Experience Researcher
With Maze, the data was incredibly easy to understand and parse because it was presented visually.
Janet Taylor
Senior Director, Product Design & Research


Frequently asked questions
Can I customize Maze reports before sharing with stakeholders?
Can I customize Maze reports before sharing with stakeholders?
Yes! You can tailor your report before sharing by adding or removing slides, editing the text on each slide, and reordering sections to match the story you want to tell. Customization options vary by study type, but you always have control over what appears in the shared view so stakeholders see the information that matters most.
What types of visuals are included in Maze reports?
What types of visuals are included in Maze reports?
Maze reports can include usability scores, heatmaps, mission analysis, card sort matrices, tree test flow diagrams, result summaries for each block, and open question highlights—all instantly generated for every study you run.
Does Maze automatically create reports?
Does Maze automatically create reports?
Yes, Maze automatically generates rich, shareable reports for every project with at least one tester, so you get instant insights to share as live links, PDF exports, or embedded in your favorite tools.