

















User experience (UX) is an essential part of your company's success. No matter how brilliant your brand or how essential your product, if your website or app is slow, difficult to navigate, and unintuitive, users will turn away (and won’t look back!).
Whether you’re catering to desktop or mobile users, the combination of good UX and seamless functionality is key to landing more sales. To help you leverage the power of great UX, sway stakeholders, and support your strategic decisions, we've compiled a list of up-to-date statistics for 2026.
Here’s what we’ll cover:
- Top user experience statistics for 2026
- Insights from our 2026 Future of User Research Report
- The importance of first impressions and the cost of bad UX design
- How UX makes or breaks the customer experience
- What mobile users expect from digital experiences
- UX in e-commerce: Design that drives conversions
- Designing for accessibility and inclusion
- The future of UX design
This piece covers statistics on UX design and the general user experience. While we include some statistics from the 2026 Future of Research Report, check out our article on 20+ User Research Statistics That Prove Its ROI for a comprehensive list.
Top user experience statistics for 2026
We searched high and low for the most insightful UX research and statistics, and these are the five that highlighted just how critical UX is for success.
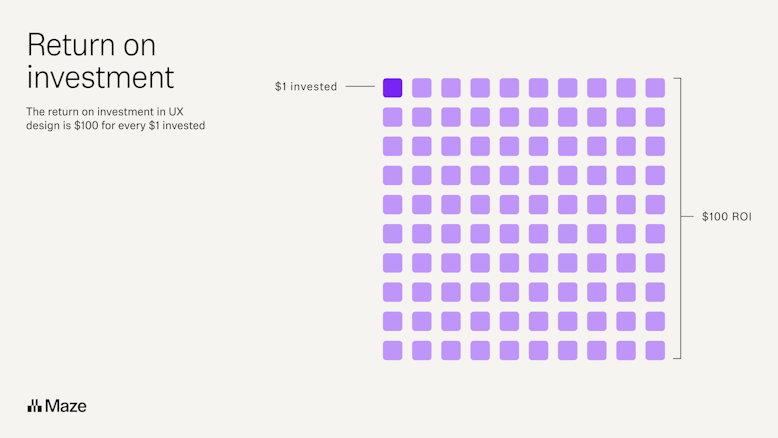
1. Every $1 invested in UX design yields a return of $100 (ROI = 9,900%). (Source)
Forrester's research indicates that investing in user experience design greatly increases a business's return on investment. While this is based on older research, it still highlights a broader pattern that UX investment can improve customer loyalty, streamline operations, and reduce support costs.

2. Organizations that invest in continuous UX testing can improve revenue retention by up to 10.8% over three years. (Source)
In Forrester’s Total Economic Impact study of the UserTesting Human Insight Platform, a modeled organization that adopted continuous UX research increased retention by 3.6% in year one, 7.2% in year two, and 10.8% in year three after risk adjustment. It shows that systematically testing and improving digital experiences leads to steady, compounding revenue gains over time.
3. Companies in the top quartile of the McKinsey Design Index achieved, on average, 32 percentage points higher revenue growth and 56 percentage points higher total returns to shareholders than their industry peers over five years. (Source)
When companies treat design and UX as strategic capabilities, they create better experiences and consistently outperform competitors on hard business metrics like revenue growth and shareholder returns.
4. 52% of customers have stopped buying from a brand after a bad experience. (Source)
More than half of customers say they’ve stopped using or buying from a brand because they had a bad experience with its products or services, showing how fragile loyalty is when UX or CX goes wrong.
5. 71% of customers feel most valued when companies respect their time and don’t make them wait. (Source)
UX success often comes from removing friction in the journey, which, in turn, makes customers feel that a brand respects their time. Simple, fast experiences can have a bigger impact on how customers feel than advanced features or heavy personalization.



Insights from our 2026 Future of User Research Report
Next up, our own research. We surveyed nearly 500 researchers, designers, and product professionals to understand how organizations are scaling UX and user research, especially as AI becomes part of everyday workflows. We’ve included some of the most interesting findings below, but you can also read the full reports below.
6. 69% of participants now use AI in at least some of their research projects—a 19% increase from last year.
Researchers are using AI mainly to analyze data (76%), automate transcription (57%), plan and draft studies (56%), and generate research questions (55%), which shows how deeply AI is embedded in day‑to‑day research workflows.
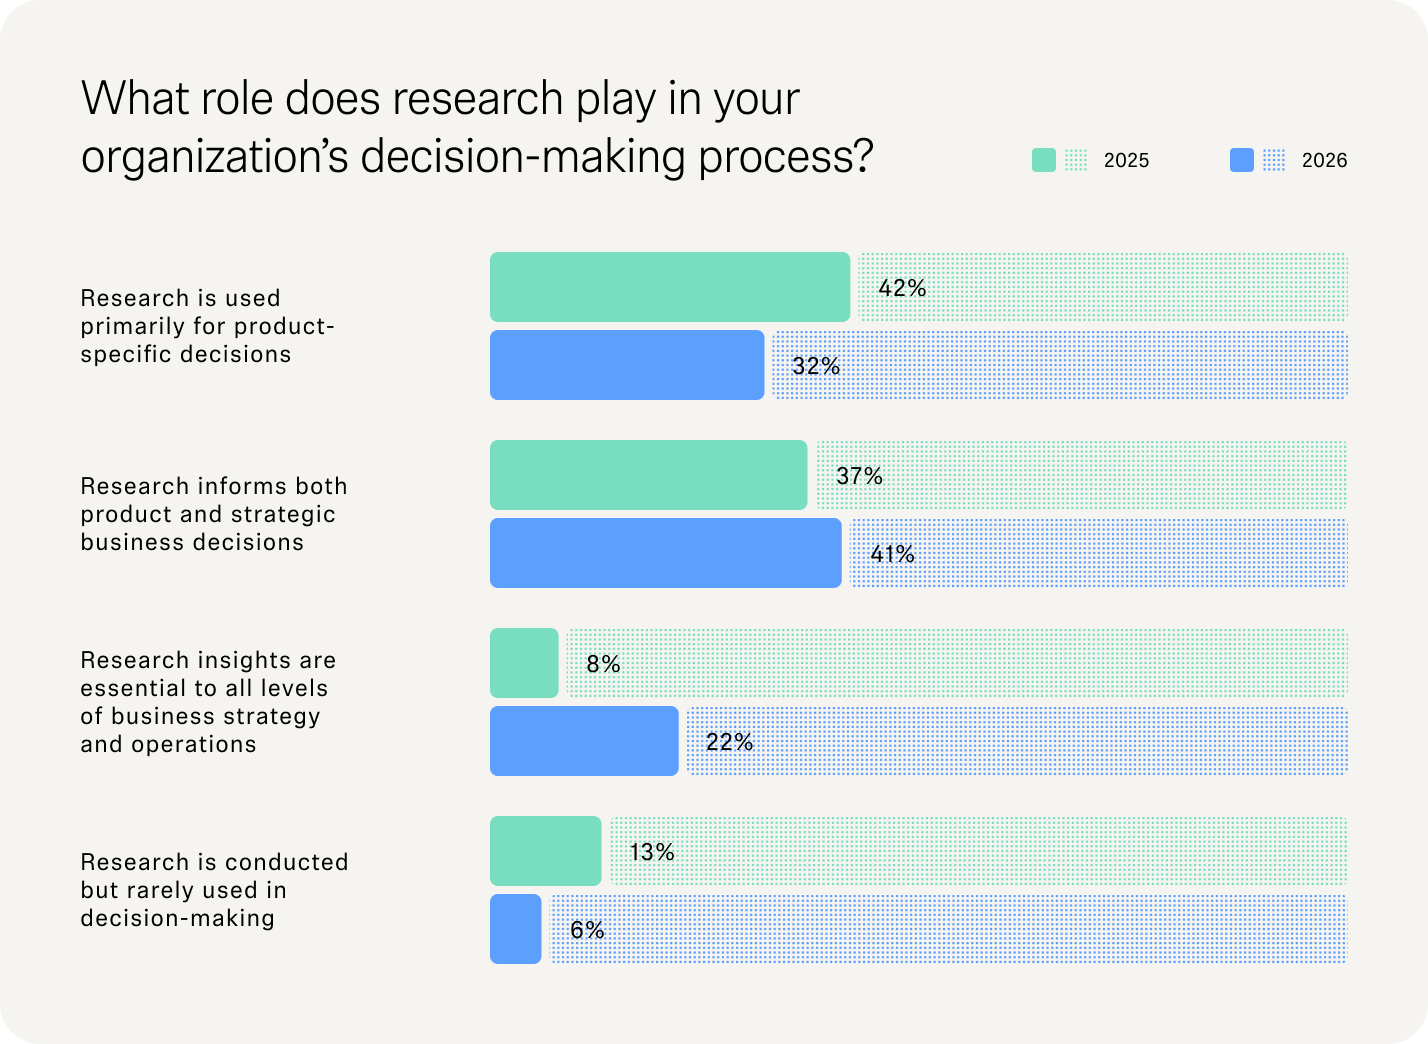
7. In 2025, 8% of participants said research was essential to all levels of business strategy and operations; in 2026, that number jumped to 22%.
This nearly three‑fold increase shows that research is shifting from a tactical function to something that genuinely shapes business strategy and operations.
8. 41% of respondents say research now informs both product and broader strategic business decisions, while 32% say it is used primarily for product‑specific decisions.
So in many organizations, research is no longer just validating UX or features but guiding what gets built and how the business moves.
9. In 2025, 43% of teams tracked KPIs and OKRs to measure research impact; in 2026, this rose to 56%. Tracking research influence on product decisions increased from 40% to 51% over the same period.
More teams are measuring research by the outcomes and decisions it affects, instead of just the volume of studies or deliverables produced.

The importance of first impressions and the cost of bad UX design
The initial interaction a user has with a digital product can influence their overall perception and future engagement. Users characterize bad UX as confusing navigation, slow load times, and unresponsive design.
A negative first impression often results in high bounce rates, lost potential customers, and a tarnished brand reputation. That’s why you need to create engaging, user-friendly interfaces from the very first interaction.
Here are some key statistics on how first impressions and bad UX design affect user decisions:
10. 75% of users admit to making judgments about a company’s credibility based on their website’s design. (Source)
11. 70% of consumers will abandon a brand after just two bad experiences. (Source)
12. People are more likely to rant about a negative experience than rave about a positive one. Around 13% will tell more than 20 people. (Source)
13. It takes about 50 milliseconds (that’s 0.05 seconds) for users to form an opinion on your website, including whether they like your site or not and whether they’ll stay or leave. (Source)
14. A well-designed user interface (UI) can increase a website's conversion rate by up to 200%, and a better UX design can achieve conversion rates of up to 400%. (Source)
15. 54% of a user’s overall experience rating is determined by just two factors: how easy the product is to use and how useful it is. (Source)
How UX makes or breaks the customer experience
UX design directly impacts customer experience, influencing key metrics like engagement, retention, and conversion rates. Here are some key UX design statistics showing how good design boosts user satisfaction and business performance:
16. 71% of consumers abandon purchases when experiences “fall flat,” while 88% say they are more likely to buy when engagement is personalized in real time. (Source)
17. On average, companies that put in the work to improve customer experience see a 42% improvement in customer retention, a 33% improvement in customer satisfaction, and a 32% increase in cross-selling and up-selling. (Source)
18. Consumers place high importance on ‘previous good CX with the brand,' citing it as their top criterion when considering a new purchase. (Source)
19. 77% of brands believe customer experience is a key competitive differentiator.(Source)
20. 94% of consumers prioritize easy navigation as the most important feature in digital platforms, while a significant 83% also consider a beautiful and updated UX design essential. (Source)
What mobile users expect from digital experiences
Good mobile UX design leads to increased engagement and customer retention, while failure to meet these expectations often results in users abandoning the app or website. In this section, we’ll highlight the growing demands of mobile users for streamlined, responsive, and user-friendly interfaces:
21. The average mobile bounce rate is 67.4%, while the average desktop is only 32%. (Source)
22. 75% of consumers value the availability of fully self-service customer care options on mobile platforms, highlighting the importance of mobile accessibility in meeting their inquiry needs. (Source)
23. Online shoppers want, and even expect, an easy and well-informed mobile experience for enjoyable shopping, with 73% of shoppers preferring to watch a short video to learn about a product or service. (Source)
24. 67% of mobile users say that when they visit a mobile-friendly site, they're more likely to buy a site's product or service. (Source)
25. 48% of customers say if a website or app isn't mobile-optimized, it’s a clear indication that the business doesn’t care. (Source)
26. 66% of mobile sites place tappable elements too close to each other, and 32% of sites have tappable elements that are too small—making it difficult for website visitors to navigate the mobile interface reliably. (Source)
Bring the power of user research to your entire mobile ecosystem
Design, test, and validate every part of your mobile experience with the Maze mobile app—from early prototypes to live app interactions.
UX in e-commerce: Design that drives conversions
These statistics highlight how UX decisions across discovery, product pages, and checkout directly shape ecommerce outcomes—from cart abandonment and conversion rates to customer trust, loyalty, and long‑term revenue.
27. A one‑second ecommerce page load can deliver up to 2.5x higher conversion rates than a five‑second load. (Source)
Portent’s analysis of over 100 million pageviews across ecommerce sites found that pages loading in one second had conversion rates up to 2.5 times higher than those loading in five seconds. This shows how a seemingly small UX detail like load time can dramatically change how many visitors actually buy.
28. Each extra second of load time can cost around 0.3 percentage points in ecommerce conversion rate. (Source)
In the same study, ecommerce conversion rates dropped from 3.05% at a one‑second load to just 0.67% at 4 seconds, which Portent equates to an average loss of about 0.3 percentage points in conversion for every additional second of waiting. For high‑traffic stores, this UX performance penalty can translate into millions in lost revenue each year.
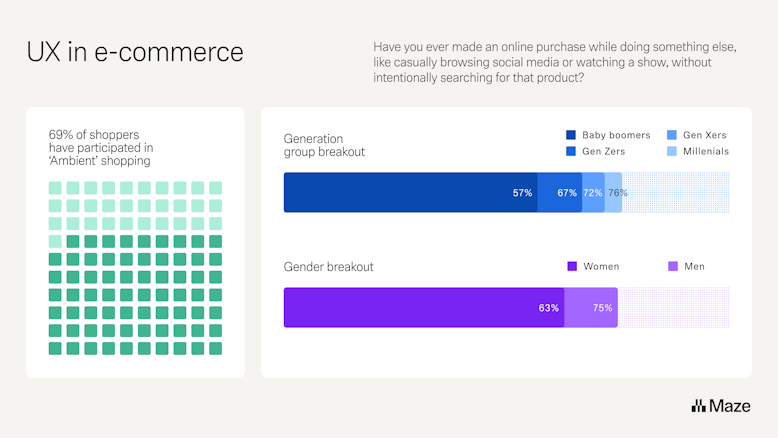
29. 69% of shoppers regularly participate in “ambient shopping,” buying products while doing something else, like browsing social media or streaming. (Source)
Shoppers are often half‑focused when they buy, so ecommerce UX has to be ultra‑clear, low‑friction, and thumb‑friendly enough to work even in distracted, second‑screen moments.

30. 66% of CX practitioners believe customer experiences improved in the last year, but only 17% of consumers agree, revealing a major perception gap that affects ecommerce as well. (Source)
Teams often overestimate how good their journeys are, which means unresolved pain points—slow pages, clumsy flows, and confusing policies—still impact trust and revenue.
Designing for accessibility and inclusivity
Accessibility and inclusive design ensure digital products work for people with different abilities, devices, and contexts. Here are key statistics that show why inclusive UX is essential for reaching and supporting every user.
31. Almost 95% of home pages in the top 1M websites have at least one detected WCAG 2 failure. (Source)
32. On the above-mentioned 1M home pages, WebAIM detected over 50.9 million distinct accessibility errors in total, which works out to an average of 51 errors per page. (Source)
33. Users with disabilities can expect to encounter an accessibility error in roughly 1 out of every 24 elements on a typical home page. (Source)
34. Organizations with high executive support for accessibility initiatives are about 7x more likely to report positive business impact from their accessibility programs than those with low executive support. (Source)
35. The most common WCAG errors on the web are low contrast text (83%), missing alternative text for images (58%), empty links (51%), missing form labels (46%), and missing page language declarations (29%). (Source)
36. 79% of home pages contain low‑contrast text, with an average of 29.6 distinct low‑contrast issues per page. (Source)
37. Accessible Rich Internet Application (ARIA) usage has exploded to over 133 attributes per page on average, and pages using ARIA show significantly more detected errors. (Source)
The future of UX design
The future of UX design holds many exciting developments—here are six emerging trends that will reshape UX research, design, strategies, and practices in the years ahead.
38. 39.3% of users say AI capabilities influence their choice of mobile product, but 72.4% cite privacy, transparency, and data control as primary concerns with AI in mobile experiences. (Source)
Users are excited about smart, AI‑powered features, but only when they feel in control of their data and understand how AI is being used. This means the winning apps must combine helpful intelligence with clear privacy choices, readable explanations, and respectful defaults.
39. 35% of participants say the researcher's role is becoming increasingly strategic, while 33% say it is becoming more blended across product and market research. (Source)
Over a third of respondents now see researchers stepping into advisory, business‑partner roles, and another third say the role spans both product and market research, showing how UX research is evolving from running usability tests to shaping product and business strategy end to end.
40. 66% of product professionals report increased demand for research this year, up from 55% the year before. (Source)
Demand for user insight is rising faster than teams can scale their systems and staffing. Researchers are asked to support more decisions than their current processes, tools, and enablement programs were built to handle.
41. 30% of respondents cite voice UI as a major upcoming UX trend, while 26% point to device‑agnostic experiences that work seamlessly across screens and platforms. (Source)
Designers increasingly expect conversational, voice‑driven interactions to become a core pattern. They also expect continuous, cross‑device journeys to be standard. This means future UX work must cover spoken interactions and handoffs between mobile, desktop, TV, and other connected devices.
Build winning products with UX design
If you want to build user-centric products, adopting a continuous product research mindset is crucial. This involves frequently connecting with users to get an up-to-date understanding of their wants and needs.
Connecting with your customer shouldn’t be a hassle—not for you, and not for them. Maze seamlessly supports your user research efforts with a comprehensive suite of UX research tools, including user interviews, UX surveys, usability testing, card sorting, and more.
While the statistics above give insights into the current state of UX, they also show the future opportunities awaiting teams that prioritize building user-centric products. Start learning about your users today.
Frequently asked questions about UX statistics
Are UX designers in demand for 2026?
Are UX designers in demand for 2026?
Yes, UX designers are anticipated to be in high demand in 2026. The U.S. Bureau of Labor Statistics projects a 16% growth rate from 2021 to 2031 for web developers and digital designers, which includes UX designers.
What is the expected return on investment (ROI) for UX design?
What is the expected return on investment (ROI) for UX design?
The expected ROI for UX design is very high, but it varies by context. Forrester research, widely cited in UX and product literature, suggests that every $1 invested in UX can return up to $100—an implied ROI of about 9,900% in the best cases.
Is UX research growing?
Is UX research growing?
Yes, UX research is indeed growing and evolving. In our Future of User Research Report, 55% of respondents said demand for user insights increased over the past year. This trend shows the growing importance of UX research in shaping business decisions and product strategies, despite ongoing challenges like time and budget constraints.
What does data show about UX impact on conversion rates?
What does data show about UX impact on conversion rates?
Data shows that UX has a direct, quantifiable effect on conversion rates:
- Pages that loaded in one second achieved conversion rates up to 2.5 times higher than those that loaded in five seconds
- Conversion rates also dropped from 3.05% at a one-second load time to 0.67% at a four-second load time, showing how performance delays can hurt conversions
- Around 70% of carts are abandoned, and a meaningful share of that abandonment is tied to UX issues such as unexpected costs, forced account creation, and overly complex checkout flows
So, the data shows that improving key UX factors—especially performance and checkout experience—can increase conversion rates by 2x or more.
Is AI going to replace UX designers?
Is AI going to replace UX designers?
No, AI is not expected to replace UX designers, but rather enhance their capabilities and contribute to the design process. AI can't replicate human empathy and creativity—crucial for understanding user needs and making intuitive design judgments.